Performance Tuning on Databricks: Photon, Liquid Clustering, Predictive Optimization (2026)
Performance tuning on Databricks in 2026 is largely a matter of letting the platform do its job, Photon for execution, Liquid Clustering for layout, Predictive Optimization for maintenance. What's left is the small set of cases where the defaults don't fit, and the diagnostic loop that gets you to the answer. This guide is the practitioner-level shape: what to enable, what to leave alone, and where to look when something is slow.
The Spark performance-tuning literature is enormous and mostly dated. On Databricks in 2026, the short version is: Photon execution is the default, Liquid Clustering is the layout strategy, Predictive Optimization runs OPTIMIZE/VACUUM automatically, Disk Cache is transparent. If your workload is slow despite all of that, you have a real problem to diagnose, not a default to flip.
Photon: what it does and what it doesn't
Photon is a C++ vectorized engine that executes supported operators outside the JVM. On Delta-table SQL-style workloads (joins, aggregations, filters, projections), it routinely delivers 2-3× speedup. On UDF-heavy code, it stops helping because the UDFs run back in the JVM. On shuffle-bound queries, Photon helps the per-task cost but doesn't make the shuffle smaller.
The diagnostic question is "what fraction of my query's wall-clock time is in Photon nodes versus not?" The Spark UI's physical plan view is the answer. If Photon coverage is high and the query is still slow, the bottleneck is elsewhere, shuffle, I/O, or skew.
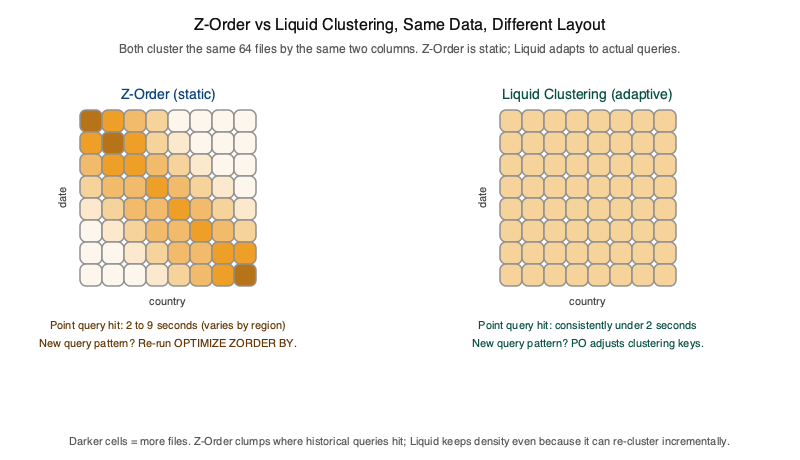
Liquid Clustering: the layout that doesn't require upfront design
Traditional Hive-style partitioning has a fundamental problem: you have to pick the right column upfront. Pick wrong (too high cardinality, skewed) and performance degrades. Liquid Clustering sidesteps this. You declare one or more clustering keys; Databricks reorganizes the table over time to cluster by those keys without the rigid partition structure.
The 2026 rule: default to Liquid Clustering for new tables. Use partitioning only when you specifically need partition-level operations (e.g., bulk delete by date partition for retention) or when the table is so large that partition pruning is the dominant performance lever and the partition column is genuinely low-cardinality and stable.
Predictive Optimization: the maintenance loop that runs itself
OPTIMIZE compacts small files. VACUUM deletes stale files past the retention threshold. ANALYZE refreshes statistics. Historically, teams set up notebooks or jobs to run all three on a schedule , and forgot to maintain them. Predictive Optimization handles it: enable once per UC catalog, and Databricks runs the right operation on each managed table when the predicted benefit exceeds the cost.
You still write OPTIMIZE manually when you have a specific reason, a known hotspot, a bulk load that produced many small files. But the maintenance default is "the platform handles it," not "the platform team handles it."
The diagnostic loop
When something is slow, the order is:
- Check the Spark UI's query profile, which stage is taking the time? Is it shuffle, scan, compute?
- Check Photon coverage, is most of the query running in Photon? If not, find the non-Photon nodes and see if they're UDFs or unsupported operators that have rewrites available.
- Check data layout, too many small files? Wrong clustering keys? Skew on the join key?
- Check compute, is the cluster sized right? Is autoscaling kicking in? Is serverless the right choice?
- Check cache hit rate, is the same data being read from cloud storage on every query? Disk Cache should be catching it.
In production, steps 1-3 cover ~80% of cases. Step 4 is usually cluster policy hygiene. Step 5 matters most when you have a SQL Warehouse serving dashboards.
SQL Warehouses: the analytics performance story
Serverless SQL warehouses in 2026 are the right answer for almost all analytics-style workloads. They start in seconds, share a result cache across users, autoscale concurrency, and run Photon by default. The legacy "pro" warehouses still exist for workloads that need specific networking or runtime versions. Classic warehouses (non-Photon) are obsolete for most cases.
What's in Volume 3 on this
Chapter 29 covers Liquid Clustering and Predictive Optimization in depth. Chapter 36 is the dedicated performance tuning chapter, Photon, the Spark UI, query profile reading, layout decisions, the diagnostic loop above with three worked examples (a slow SDP pipeline, a slow SQL dashboard, a slow ML training job). Chapter 24 covers compute selection, which is the upstream decision that prevents most of the tuning questions in the first place.